A Report is a great way of showing important information to you in graphic, detail or summary form. This data can be exported to PDF, Excel or CSV.
This article is going to walk you through:
1. Navigating the Reports Module
2. Creating a new Report
3. What to do if you accidentally delete a Report
4. Managing your Scheduled Reports
You can show report data on your home page, giving you an overview of the data you wish to see.
Examples of Reports are:
- A list of Sales Orders created by members of the Sales team on a weekly basis.
- A list of how many invoices are raised for each Company.
- How many Helpdesk tickets are raised by each Customer.
This can be a one-off report or a recurring one that is set to occur when you need it – monthly, weekly - you can select and define how often the report needs to be run. You can also select which users you would like to receive these scheduled reports.
You can create reports for one or more modules (for example Contacts and Opportunities) and in addition to the module reports you are able to report on Opportunity Revenue, Opportunity Sales Stage and Audit Trails, enabling you to track and report on record changes in OpenCRM
The Reports Module
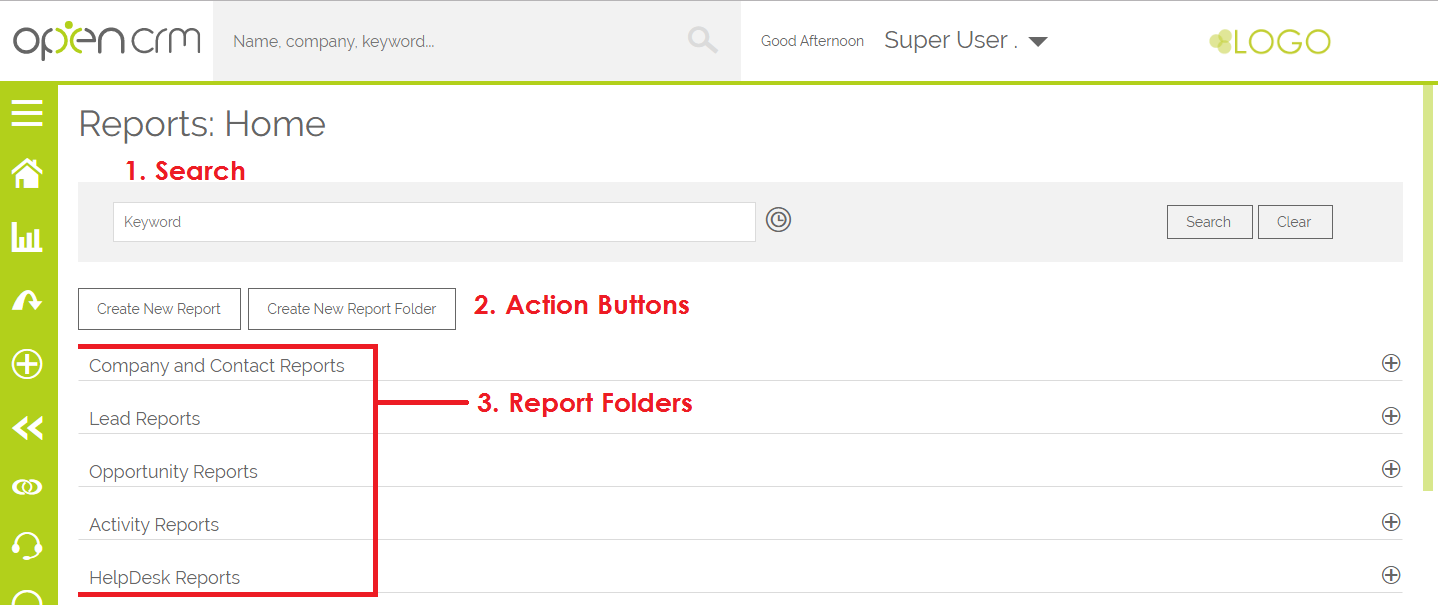
When you first navigate to the Reports module, you will see that it looks different from the other modules in the system, but the general idea is the same:
- Search - you have a place you can search for the records you've created
- Action Buttons - you have the actions you can do in this module
- Content - you have the content...in this case with all your Reports in their correct Folders
Searching for Reports
To search for a Report, simply type as much of the name or description as you remember and click Search (or hit enter).
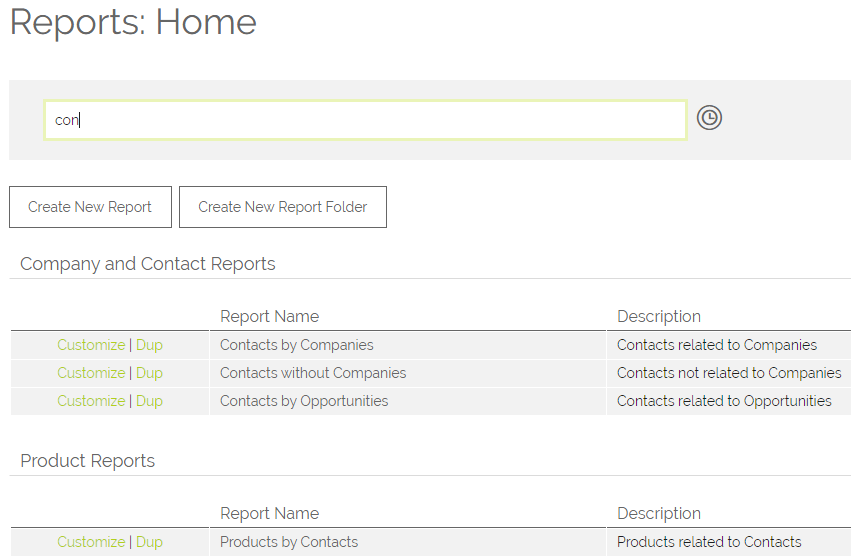
If you want to make sure that you are only searching for automated or scheduled Reports, simply click the little clock icon to the right of the keyword search bar:

This way you can easily find all the Reports that have automated schedules and easily see what the recurrence of that schedule is without having to actual edit the Report.
Creating a new Report Folder
You are able to create as many folders as you need to organise your Reports.
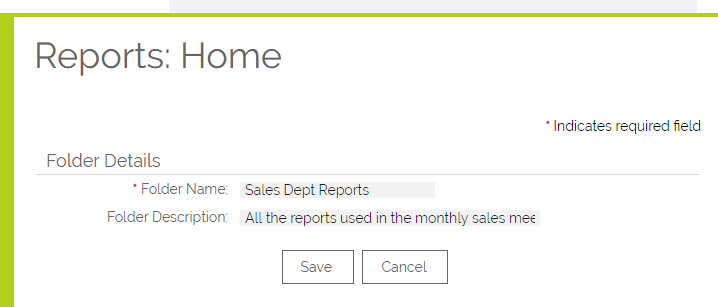
To create a new Folder, simply click the Create new Report Folder button and type in the title and description of your folder.
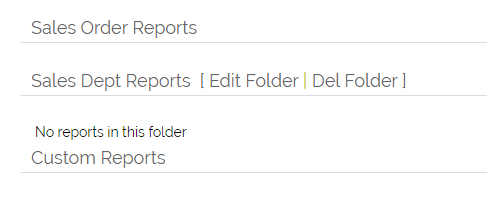
Once you have created the folder, it will appear on screen...but until you save any Reports to it, it will show the following message.
Creating a Report
Before you get started:
- Ensure you are starting in the correct module – if you start in the wrong module, for example you are in Contacts module and want to create the Report relating to Personnel, you will need to start from scratch again.
- Decide which module in OpenCRM is likely to be home to the bulk of the data. E.g. if you want to see a report showing Invoices, by company raised, the logical step would be to create an Invoice Report, since the Invoice will hold the Company name. However if you also wanted to see, in the same Report the contact information for that company, for example, or any company specific information which is not stored on the Invoice itself, you will need to select 'Companies' as your Related Module.
- Conversely, If you require a lot of Company data and only the name or the date of that companies' most recent Invoice then your primary module should be the 'Companies' module and the related module would be set to Invoices.
- You also need to consider how much data you wish to feature in the report. This is where you need to filter data. A report showing ALL leads is likely be too big to be of any use, a report showing new leads from the last seven days is probably more useful.
Let’s create a report to show Quotes by Company.
Go to the Reports Module and select New Report, and then select the Modules that you want in the Report, in this case Companies and Quotes and click on Continue.
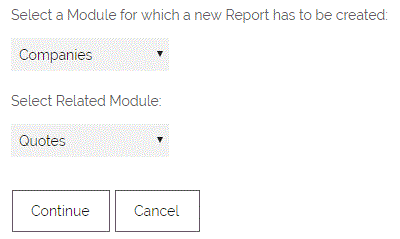
Step 1: Report Type
You will need to select the type of Report you would like to run. A Tabular report will show you a grid of all your data. A Summary report will show you this same grid and then, at the bottom, show the sums, counts, etc. of particular groups of fields. (For example, you may wish to group this example report by User, to see who is generating the most Quotes).
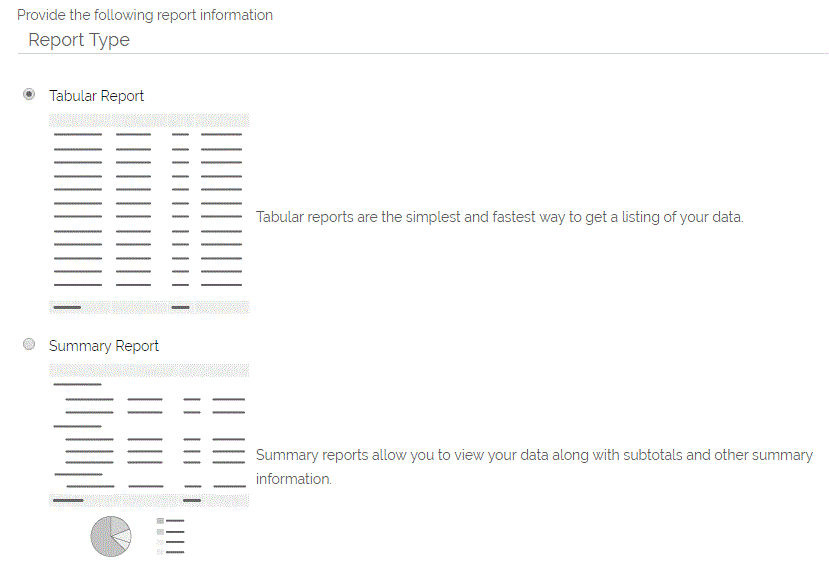
In this example, we'll create a summary Report.
Step 2: Columns
We now need to select which columns we want to show on the report. Make sure you include any columns you need to filter on or sort by.
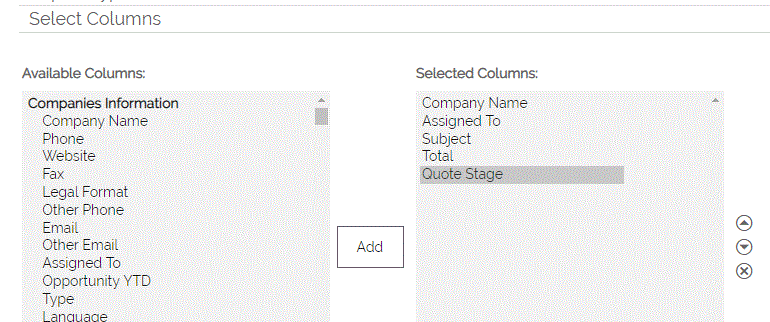
The menu on the left allows you to select the fields from the Companies and Quotes modules. In order to show Companies that actually have Quotes linked instead all Companies we now need to apply a filter to remove records where the Quote field is empty. This is done by specifying the criteria, the filters work the same way as when creating Custom Views - please refer to this FAQ.
Step 3: Grouping
This will only appear if you have selected to create a summary Report.
Here you can select how you wish to group you data. For example you may wish to see all the Quotes grouped by the Company and their assigned user.
If you are planning to show any totals or counts, make sure you tick the "Display group totals" boxes.
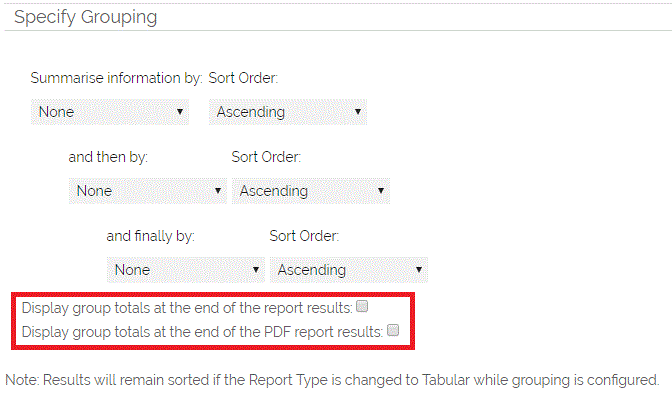
Step 4: Totals
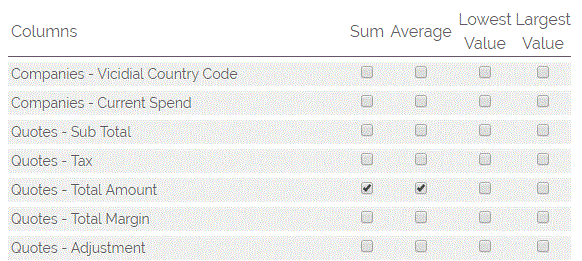
This is where you will select which number fields you would like to see totaled by the groups you selected in the previous step. For this example, let's assume we want to see the total amount for all the Quotes, as well as their average.
Step 5: Filters
This is where you will filter down your data to make sure you only see the records you most need to view.
As you can see in the screenshot below, we have set a further filter to only show Company Quotes from the last month that have not been cancelled.
We can also sort the view according to any of the fields we have entered – User, Company or Quote Stage.
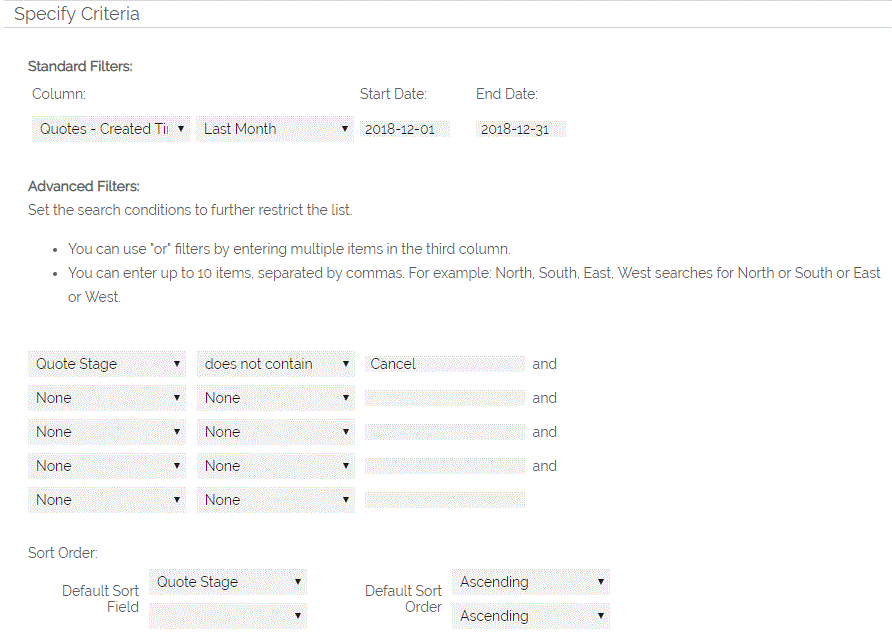
You can filter using the pre-set financial periods. You can also set up your own financial periods by following the steps in this FAQ.
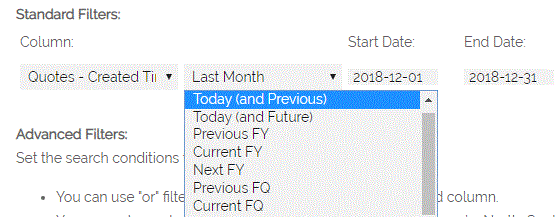
When you're in the standard filter section you will have some additional options when you select "custom" you will be able to select "Selected Dates", "Next", "Last", "More Than" and "Less That" you will then get the choice of unit of time so 1, 2, 3 etc then you will have option between Days, Weeks, Months and Years. So for example you can select to list in a Report all Companies created in the last 3 days:

Step 6: Scheduling
You will now see series of options, that will allow you to specify the frequency of the schedule and who should receive the report, sent by email. You have a time field which allows you to specify the time that you wish the report to be created.
Important: Be sure to set either a Number of Recurrences or an End By Date before you hit Save.
Within this container is a user multi-select pop up and contact selector, similar to that found on Emails. Click on either of the icons to select who you wish to send the report to.
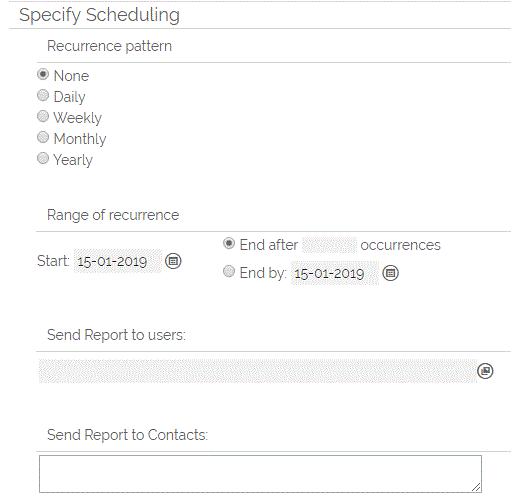
Once a Contact has been added to this box when the report is ran on a schedule it will send the generated PDF to the specified contacts.
For more information on our tips on the best ways to manage your scheduled reports, please scroll down to the bottom of this article for some tips.
Step 7: Graphing
Important: You can only set a graph on a summary Report.
Important: If scheduling a report with a 3D graph, this will be converted to 2D when scheduled.
The X (horizontal) axis will by the fields you set as the Groups. the Y (vertical) axis will either be the columns you totaled or (if you prefer) you can use a count of the records by setting Number of Records under Graph Values.

Step 8: Home Page
If you would like the graph, Report grid, summary, or a combination of those results on your or any other users' home page, you will need to set this here.
Step 9: Security
If you do not make any changes to this section, your Report will be assigned to the person who created and the security will be set using the Default Organisation Access you have set up.
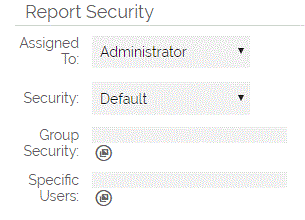
Should you wish to restrict access to this (or any other) Report, you can do so by
1. Selecting the User to whom the report is assigned, this will by default be the User creating the report, when creating the report you have the ability to reassign.

2. From the next drop-down menu you can select the report security level:
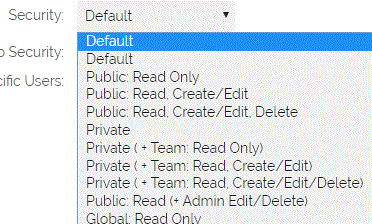
3. You can use the final two menus items to select and restrict access to the report at both Group and User level.
Step 10: Results
By clicking "Save and Run" you will be able to set the name of your Report and choose a folder for it.
We do suggest giving it a sensible name and description so you (or anyone else) can find it later.
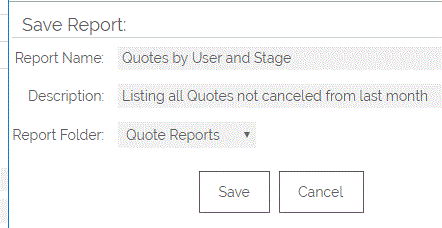
You now have the finished report, which can be exported to PDF, Excel or CSV file.
Getting your Filters Right on Reports
One of the trickiest things about getting your Reports to show exactly what you want to see comes down to getting your filters right. To help you with this, we changed the way you interact with your filters after you have run your Report.
Just below the filters, you will see three buttons: Customise, Apply Filter, and Save Filter.
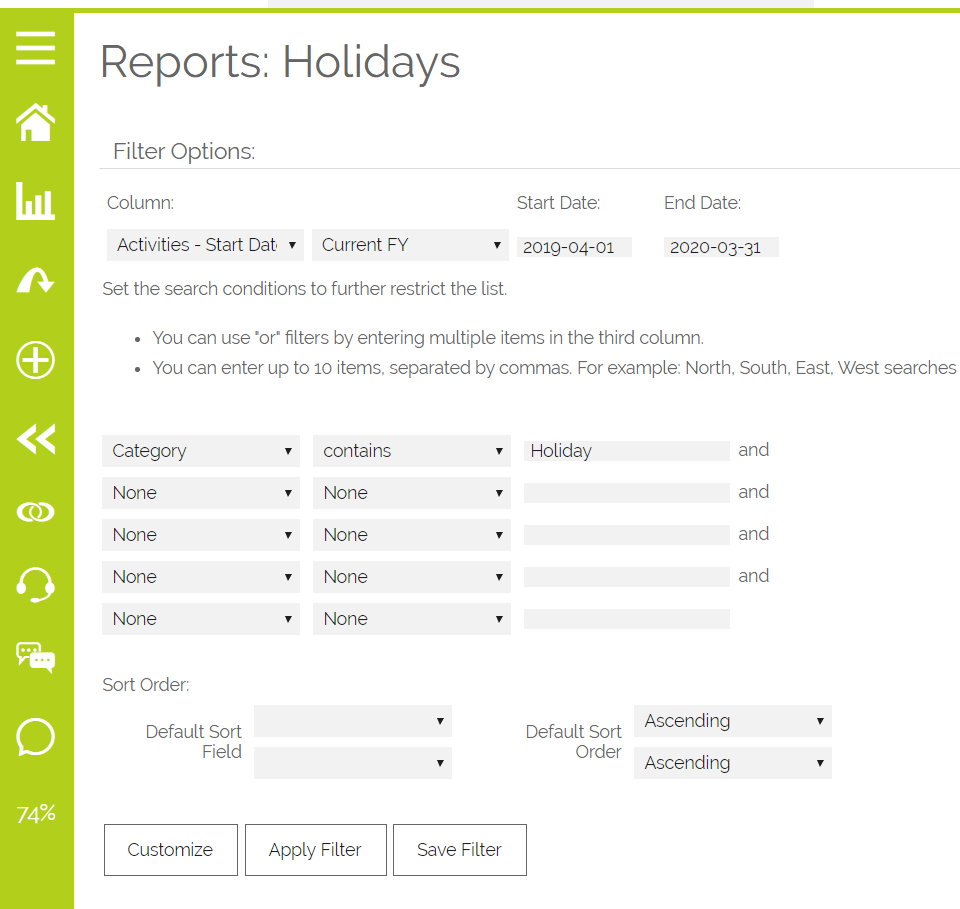
Customise will take you back to the edit screen - this is perfect if you want to add a couple of new columns, adjust the grouping, or make other "big" changes.
Apply Filter will apply any changes you have made to the filters while on this screen WITHOUT saving them to the Report. So if you are trying to work out the right dates or just need to compare some numbers on the fly, this is a great way to make changes without affecting your Report in the long term.
Save Filter will save any changes you have made to the filters to the Report for the long term.
Can I delete Reports and Report folders?
The ability to delete Reports and Report folders is governed by the permissions at the Profile level. So if you do not see the links and buttons discussed below, you will need to speak with them about getting permission.
To delete a Report, simply click the "Del" link to the left of the Report name.
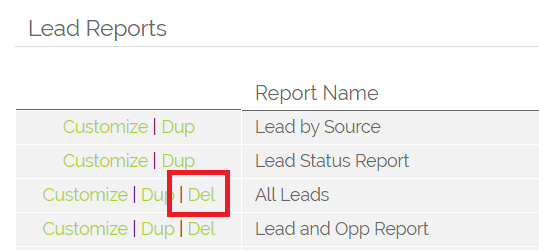
To delete a Report folder, there are a couple more steps:
1. First you will click the "Del Folder" option next to the folder name
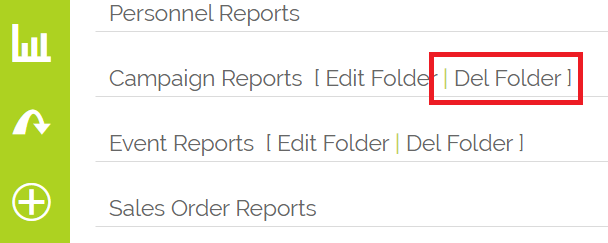
2. Once you have clicked this, you will be taken to a screen where you can choose what happens to the Reports within the folder you are deleting. You can either Delete or Move your Report
If there are a lot of Reports in the folder and you want to move or delete them ALL, you can click the "copy" button on the right side (red arrow in the below screenshot) and that will copy your choice
Should you decide to move a Report, a dropdown list will appear where you can select which Report folder you would like to move it to: 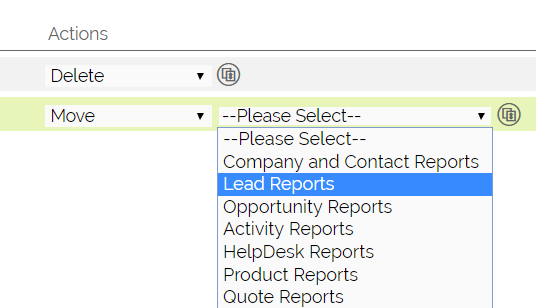
3. Now you can click Save at the bottom of the screen and you have deleted your folder
How can I restore a deleted Report or Report folder?
If you have accidentally deleted a Report or Report Folder (and don't worry, these things happen), you will need to contact one of your System Admins to restore it.
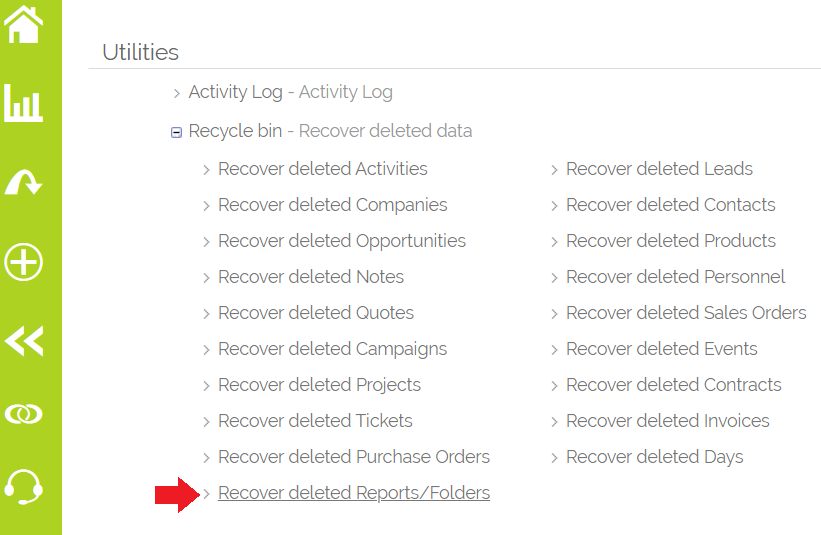
Navigate to Settings and then scroll to the bottom of the screen to the Recycle Bin area and click "Restore Deleted Reports/Folders"
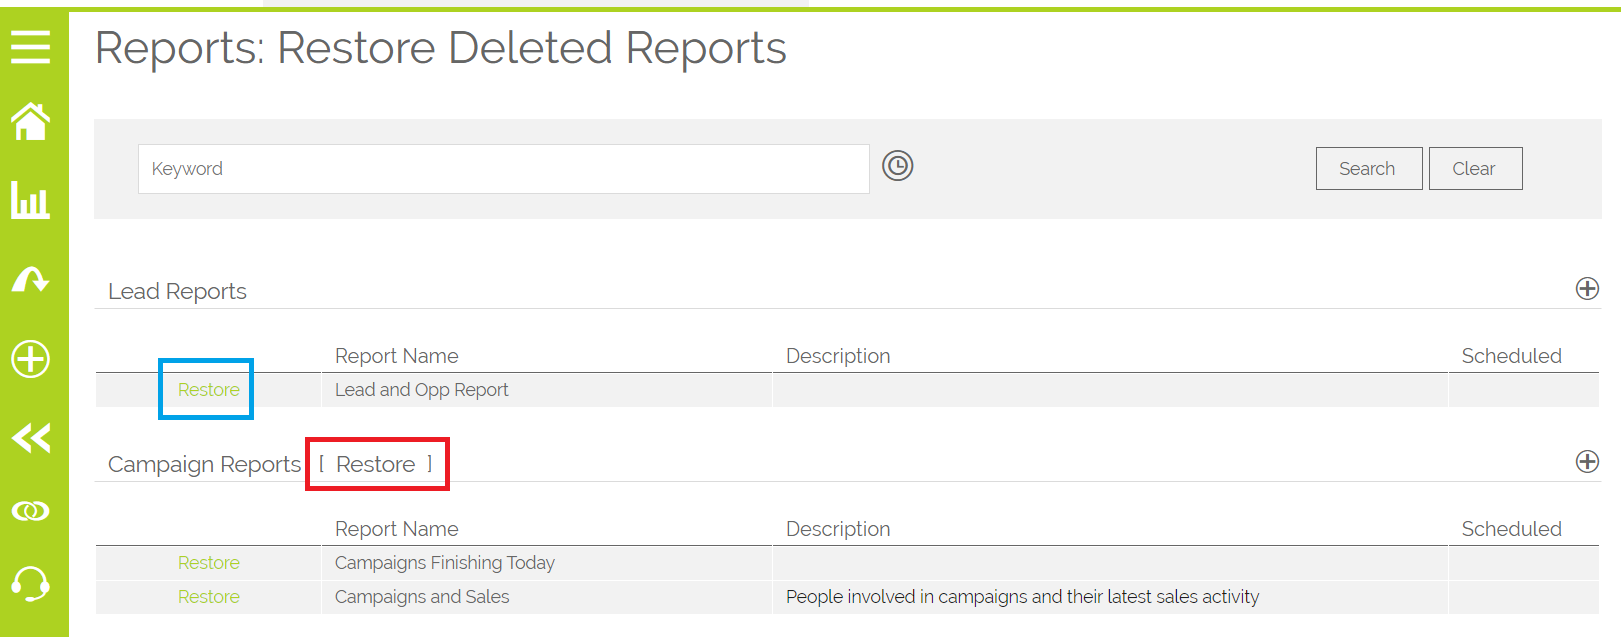
From here you will be able to search for any deleted Report or Report Folder.
To restore, simply click the Restore link at the left of the Report name or the right of the Report folder. If you restore a folder, it will restore ALL of the Reports within it.
Managing your Scheduled Reports
We've got some tips and best practice guidelines for managing your scheduled reports.
Setting the Default PDF and Email Template for scheduled Reports
In the same way that many automated emails can be modified you can amend the Default Email template that is used when OpenCRM generates a Scheduled Report.
To make changes to this template follow these 2 steps;
Step 1: Create or Edit the desired Email Template
- Settings (Top Right - this will only appear if you are a System Administrator - if you cannot see the Settings option please contact your Administrator for assistance)
- Communication Templates > Email Templates
- Browse to the Template you wish to use OR create the new Template
- Generally vanilla systems will have a Template setup which is stored within the Default Templates folder - called 'Scheduled Reports'
- Once created / amended find the ID Number of this template
- This can be done when viewing the email template and looking at the number that is shown in the URL address bar at the end after 'templateid=xxx
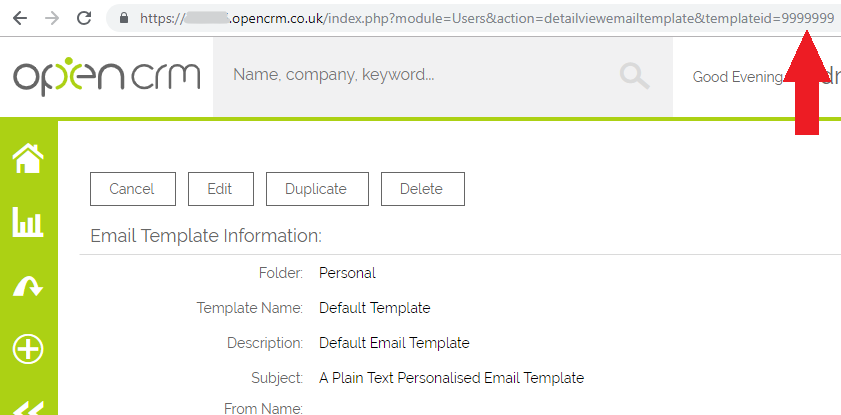
- This ID Number should be entered during phase two of this process
Step 2: Tell OpenCRM which Email Template to use
- Settings (Top Right - this will only appear if you are a System Administrator - if you cannot see the Settings option please contact your Administrator for assistance)
- Configuration > Additional Settings
- Scroll down to the section headed - Email Settings
- Locate the Default Scheduled Report Template option - the box to the right shows the ID Number of the template to be used
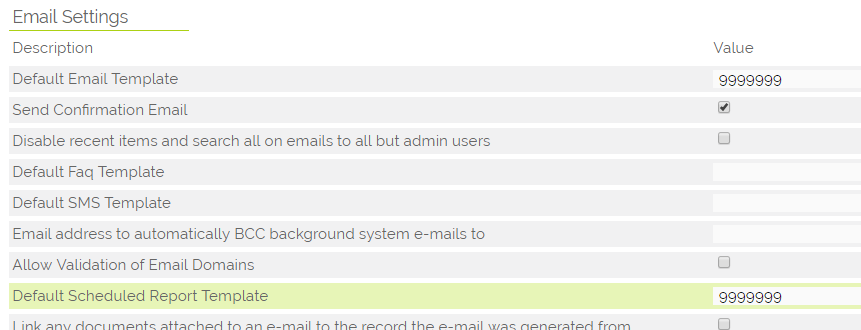
- Insert or change this value to correspond to the Email Template you wish to use - see above
- Select Save.
When creating a template, be aware that the subject will be replaced by the name of the report that is being sent plus the date is is sent on.
Best Practice for saving your scheduled Reports
The report you create maybe one that you wish to run manually as well as having it delivered by email. Our suggestion is that you create a normal report and save this into an appropriate folder group - so an Invoice report that shows figures for a set period would be created and saved into the Invoice Reports group.
Once you are happy with the report you should create a new Report Folder - label it very obviously for automated reports, something like "Automated Reports" or "Scheduled Reports", then duplicate the report you created earlier and set up the schedule options, the period that you would like to receive the report and which people (users and contacts) you wish to receive a copy. Then save this duplicate into the automated reports folder you created earlier.
Having a duplicate saved under your automated reports folder will keep the normal report separate so that if you run this mid month and need to change the parameters of the report you will not accidentally change the data that is sent automatically, you will then always have a consistent report delivered at your pre-defined scheduled time and also a version that you can run manually and tinker with without fear of messing up the automated version.
Troubleshooting:
If you are finding a blank column on your report, you need to check the parameters of your search. If for example, you select a view to show all Quotes created for Companies, you need to filter the results so as not to show blank records.
Need More Help?
If you have any questions, just start a Live Chat, "Click" on the Chat Icon in the lower right corner to talk with our support team.


